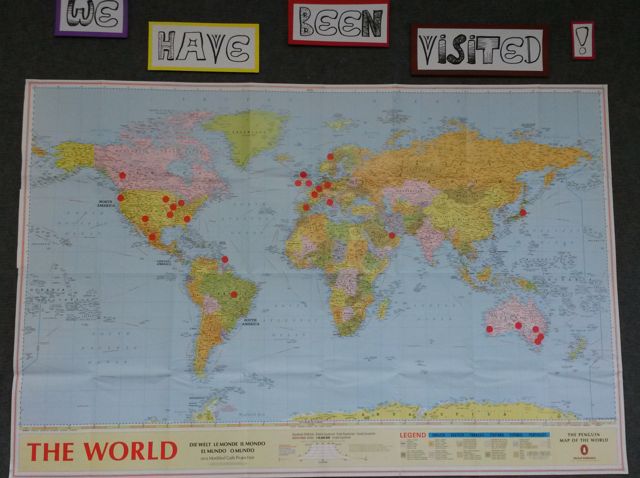
Where in the world do our visitors come from?
Article written by Eliza and Levina
In maths our class has been learning how to make pie graphs. The pie graph was about who has visited our class blog. Firstly we drew up a table of all of the countries that had visited our blog, then we did the tally, fraction, decimal, percentages, then we worked out the sector sizes. Once we worked out the sector sizes we were able to draw our pie graphs, we used a protractor to draw up the sectors.
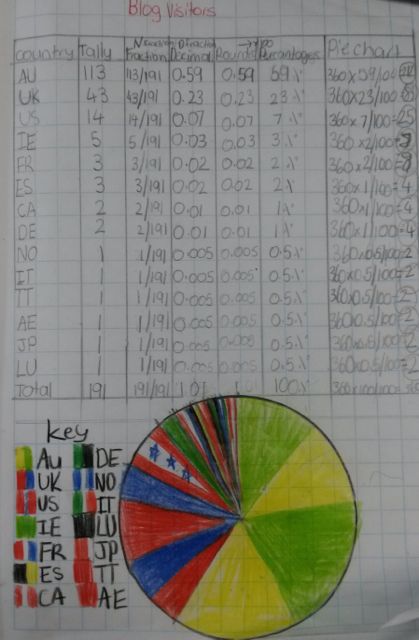
Holly’s calculations and pie graph
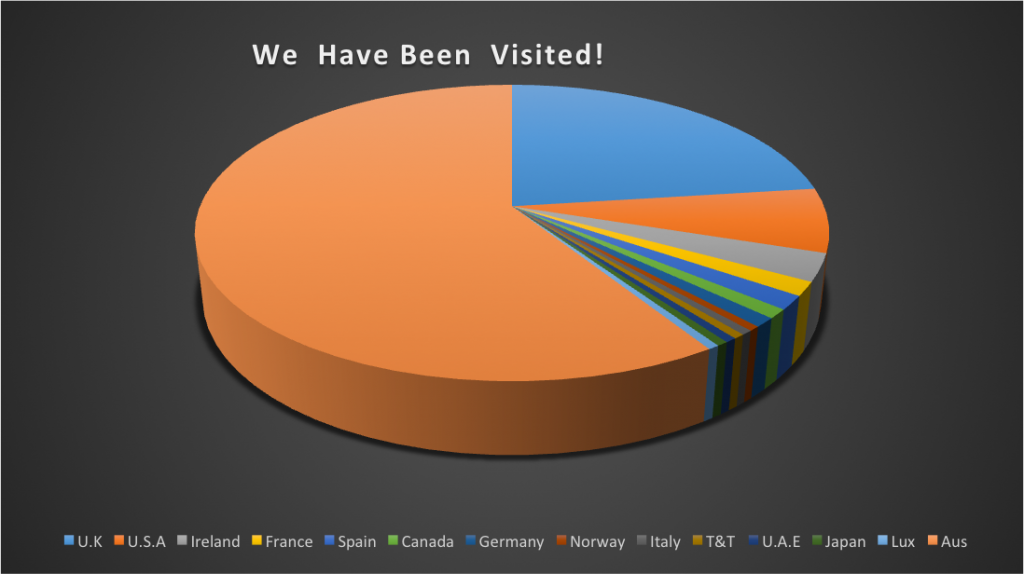
Wil used Excel to produce a pie chart on the computer.